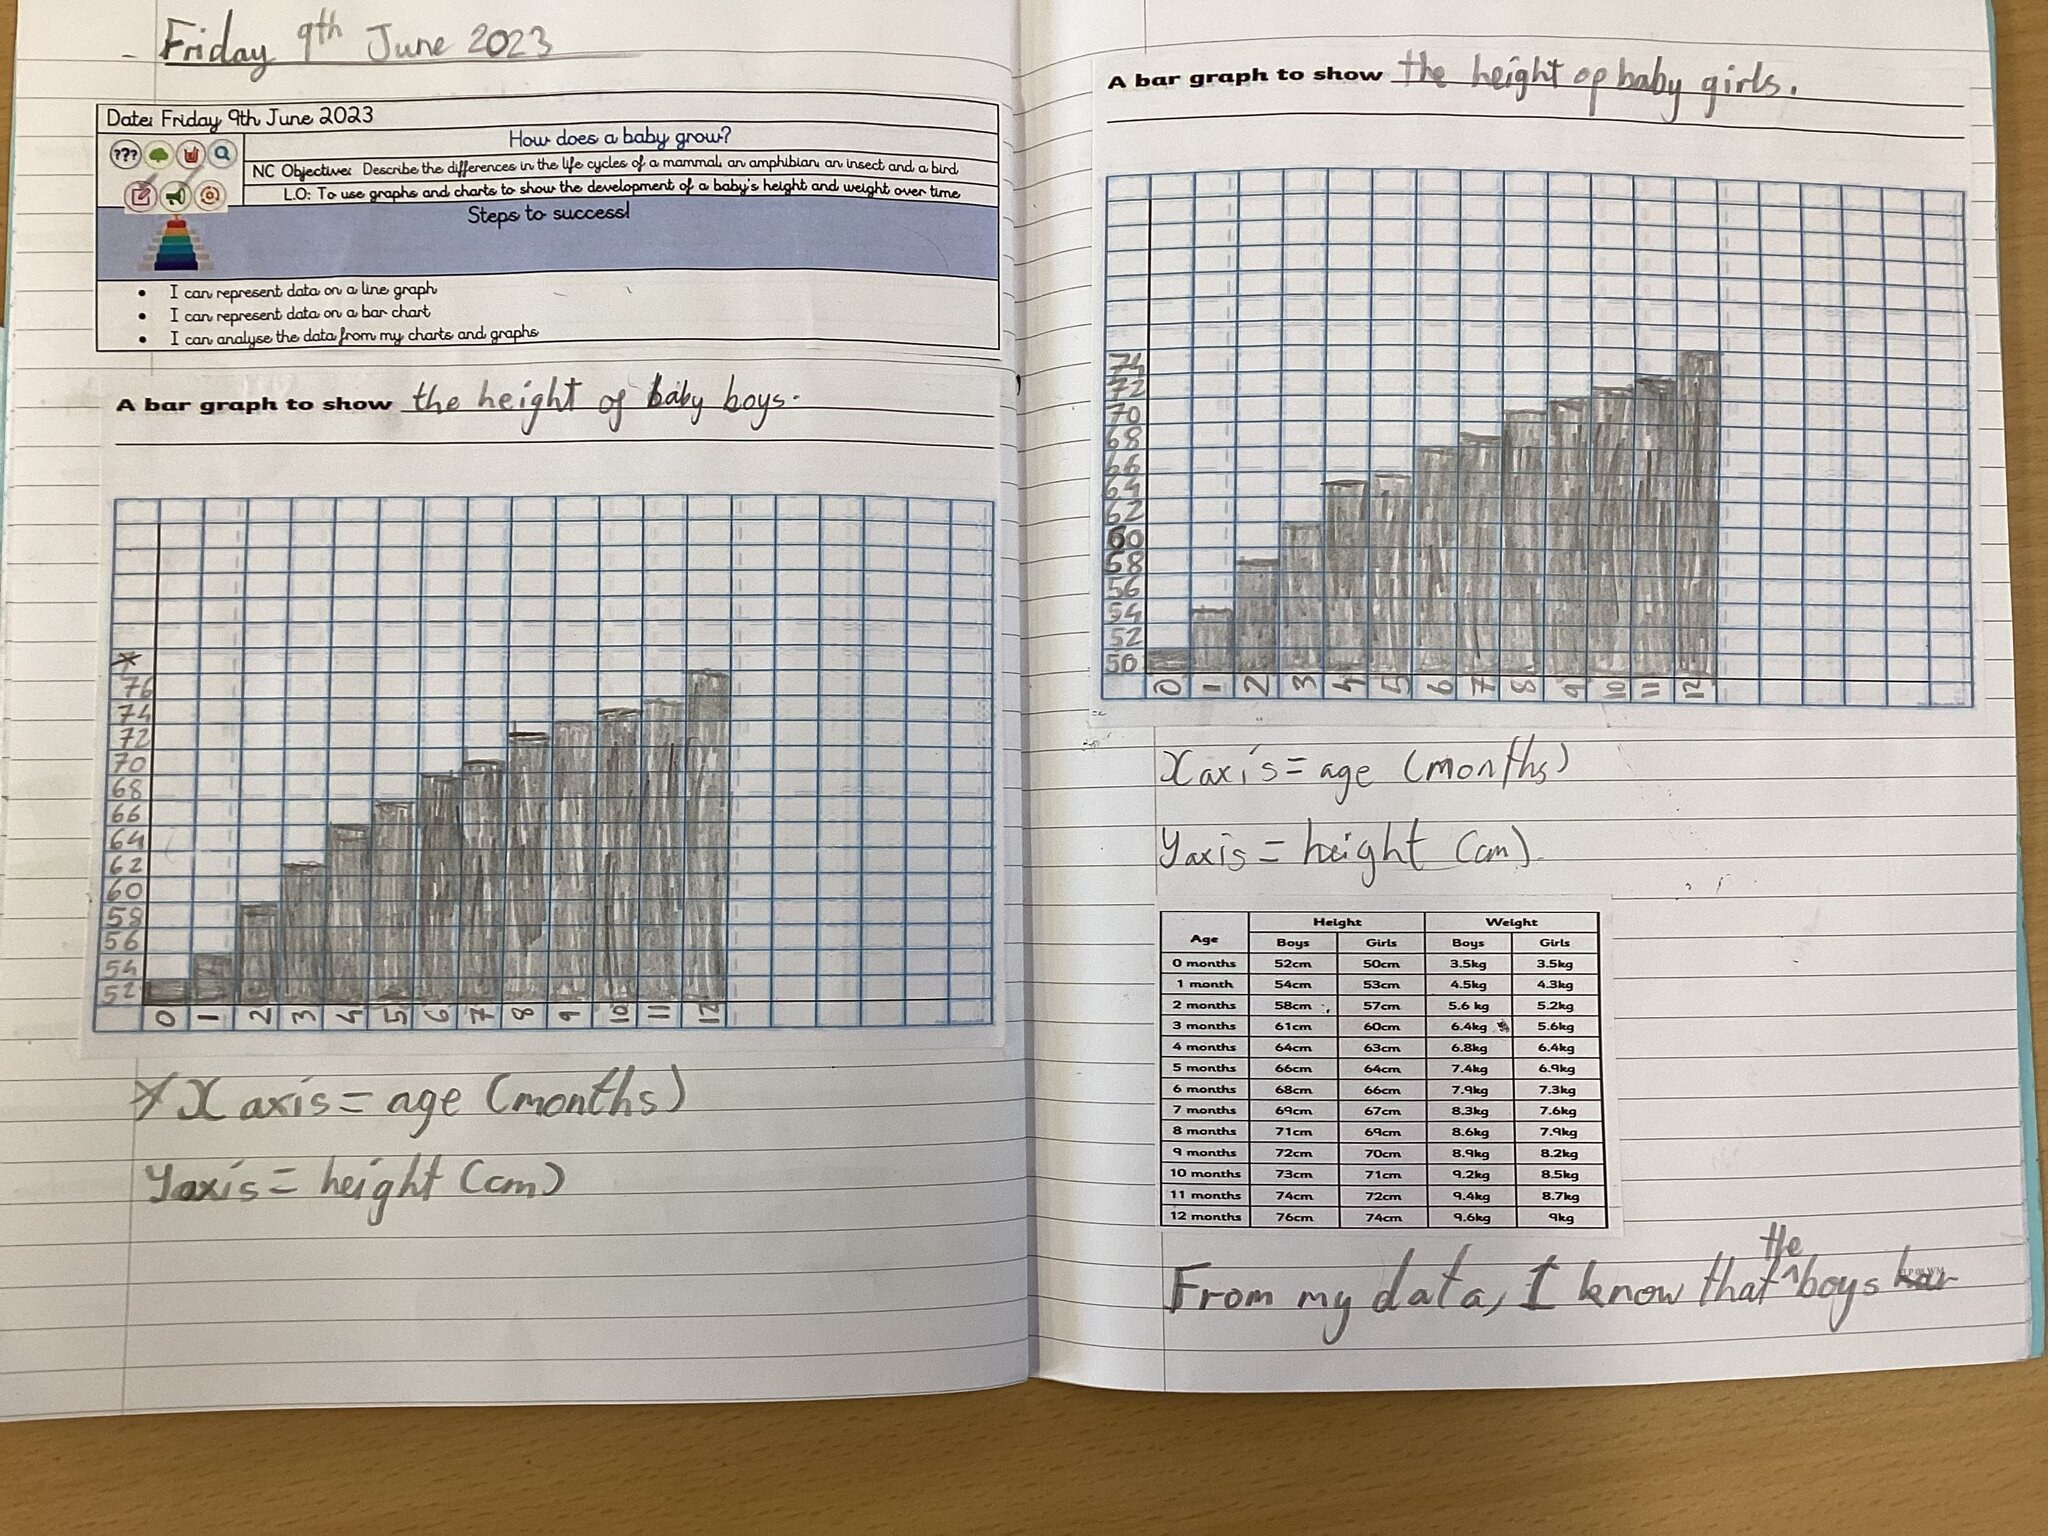
In science today we have looked at how babies grow and develop, two things we have focused on specifically are the height and weight changes from 0-12 months old. In order to represent our data we looked at using line and bar graphs to create a representation of given data, the children were able to point out how boys were taller at each month and that all of the values increased each month